How to analyse customer journeys and improve your website
To serve the needs of your customers, it’s important to consider the journey that each of them will take with your company and your brand, through all stages of the marketing funnel. This covers when they:
- first become aware of the products or services you offer
- are considering the various companies and products available to them
- make a purchase, or commit to your services.
Whether your customer is a regular or seeing your brand for the first time, its beneficial for your business to ensure they have a smooth path from their initial encounter to the point of ‘success’. The fewer issues they encounter, and the easier they can find what they’re looking for, the more likely they are to make a positive impact on your bottom line.
Have you considered this in relation to your website? Does it cater for the needs of current and potential customers, no matter what stage of the journey they’re at? And how can you use data analysis to find and resolve key issues with your site? Our guide will help you to answer these questions.
What is the customer journey?
The customer journey can be defined as follows:
The complete sum of experiences that customers go through when interacting with your company and brand. Instead of looking at just a part of a transaction or experience, the customer journey documents the full experience of being a customer.
The customer journey includes a number of different touch points, many of which are offline, such as awareness gained through media advertising, interactions with support staff over the phone, and visiting physical stores. This article focuses only on the customer touch points related to your website. However, there are still many different kinds of visits that users can make to your site – and therefore many touch points that you need to consider when analysing your customer’s journey online:
- Has the customer just become aware of your brand and typed it into Google? Then they’ll likely arrive at your site on your main homepage, looking for more details about your company and reassurance of your credentials.
- Are they Googling for a specific product or type of product that you happen to offer? Then they’ll likely start on a deeper page on your site, such as a product information or category page. While the customer needs to learn more about the specific topic of their search, they’ll also need to be brought up to speed on why they should give you their custom, rather than any of your competitors.
- Has the customer bought from you already? Are they checking up on a previous order or looking for some help? Then chances are they’ll have followed a link in a confirmation email straight to your site’s support section, and need to find the answer to their questions with minimum effort and maximum reassurance.
- The customer may not be interested in any e-commerce facilities your site may offer, and are instead looking for the address of the physical store nearest them. This means they’ll be heading for your store directory, and need to know where and when to go the store.
This is by no means an exhaustive list of the customer touch points you need to consider – many are likely to be specific to what your customers require from your business. While considering the homepage and a few category pages will be beneficial, it’s not the full picture.
How can data analysis help?
You probably already use Google Analytics (or a similar analytics solution) on your company’s website, which, providing this is set up correctly, offers a wealth of useful data about how people are interacting with your site. Careful and thoughtful data analysis can help you to determine where problems are arising in your customers’ journeys, and highlight areas where your site is currently working well.
Without considering the data, you’d have to just guess – attempting to put yourself in the shoes of your customers and make assumptions as to how they think and behave is a risky strategy. If you’ve been living and breathing your brand on a day-to-day basis, removing your thought processes from what you already know is easier said than done. Besides, if the data is there and can remove the guesswork, then it just makes sense to use it!
How to analyse the customer journey
There are many metrics and data sets you can use to analyse customer journeys on your website. Here we’ll consider the five most likely to benefit your business:
Ranking URLs
Consider the users who arrive at your site via organic search – the URL they arrive on will be dictated by the search engine, and this might not be the one you expect. If a user searches for a particular type of product and you have a whole section devoted to it, Google may still send the user straight to your main homepage. Ranking in top position doesn’t guarantee that a user will land on a page related to their search.
You can check ranking URLs manually by looking at the relevant search engines yourselves, or track them over time using tools such as STAT or Accuranker. If the pages that are ranking don’t match the keyword the user is searching for, or their intent, you need to fix this.
First, make sure you actually do have a more suitable page that you think should be appearing. If you do, then it looks like search engine optimisation work is required, to try and persuade Google to change its mind.
For example, at Gravity Global we identify and monitor key terms for our clients as part of our SEO campaigns – we look to rectify issues and get the most suitable pages ranking in the best possible positions. This means ranking pages will provide a better user experience and experience improved conversion rates.
Exit rates

When a user reaches a key page on your site, such as a product or category page, you ideally want them to proceed towards the related point of conversion. However, if the content they land on doesn’t meet their needs – for example, because crucial details are not being explained or the next action required of the user is unclear – then they may leave the site and go elsewhere.
The ‘exit rate’ metric is the percentage of views for a specific page that result in the visitor leaving the site. Google Analytics allows you to see the exit rate for every tracked page, as well as the average for the site overall. If you find that an important page has a higher exit rate than the average, you should treat this as a potential red flag and take action.
Look at the content of the page that’s performing poorly and try to determine where it might be failing to meet the user’s expectations. Also, make sure it’s obvious what the user needs to do next – if the user can’t work out what’s required of them, they’ll probably find alternative means – or alternative companies – to get what they need.
However, be wary of exit rates – on some occasions, a page might naturally be the end of a successful journey without being a designated conversion. For example, if a mobile user searches for their nearest store and lands on the page with this information, their current need has been met, so an exit is a likely outcome.
Internal search

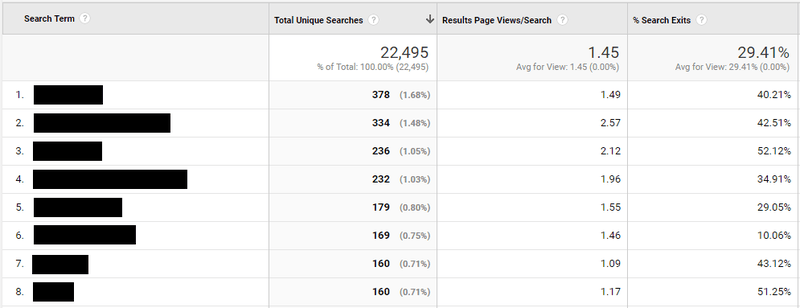
Google isn’t the only search tool where you need to consider results. If your site has its own internal search engine, then Google Analytics can track how people are making use of this facility on your site and what they’re searching for.
This data may show that some of the most searched for terms are products or services that you don’t offer. This can be a useful indicator for areas of future expansion within your company.
If users are searching for products or services that you already provide, this may suggest that people are having trouble locating the relevant pages in your current site structure. From this, you may decide to make these pages more prominent, for example using conversion optimisation or content marketing techniques.
Conversion and goal analysis

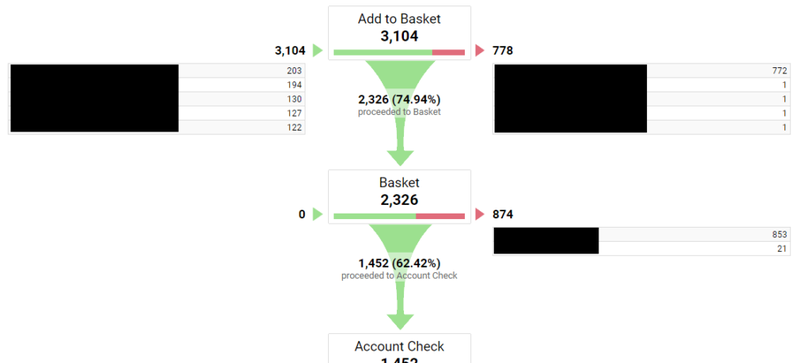
Common conversion processes are typically spread across multiple pages of a website – for example, making a purchase usually involves adding products to a cart, one or more pages of entering details, then making the payment before the final conversion is complete. Your hope is for most users to complete the whole process, but this isn’t always the case and many users stop the process before completion.
You can use a funnel report (assuming these various stages are setup correctly within Google Analytics) to map the customer journey through this process and analyse where users are dropping out. This can be helpful for determining where potential customers are encountering problems, and where improvements need to be made.
For example, let’s say that 80% of users who put an item in the basket make it to the page where they must enter their address – but only 40% get to the page following this. This means it’s highly likely that there is an issue on the address entry page.
Once you know there’s an issue with a certain page, you can use conversion rate optimisation to make improvements and encourage users to continue through the conversion process.
Performance by device

Many websites still have usability issues on smaller screens – but the number of users accessing the internet via mobile devices continues to grow. While your site may be performing brilliantly for those using a desktop computer, what about the potentially sizeable number using their iPhone or Android handset?
Google Analytics tracks the category of device used for each visit to your site, allowing your data to be segmented by device type. This means you can easily compare the performance of each, to determine whether those on a mobile or tablet have a noticeably lower conversion rate.
If you do find that conversion is poor for mobile or tablet users, the next steps are to determine why, and how to fix it. When Gravity Global identifies this as an issue on a client’s website, we usually recommend a full audit of the site from the perspective of both SEO and CRO, looking for potential quick wins and improvements in key areas to make sure users have a good user experience no matter what device they’re using.
If you’re looking to improve your website performance and customer journey we’d be happy to help. To find out more about how we can assist in your performance marketing click here. Alternatively email hello@www.gravityglobal.com.


